All about Maps

Most of us can read books and draw pictures (but perhaps not well...), so reading maps
should not be too difficult. Maps are just a picture of the landscape and the words on
the map provide things like road names or place names.

There are many types of map...

Melway/Street Map

Most of us are familiar with standard street maps. This is the view that GPS mapping or car navigation systems use. 

The typical purpose of these maps is to navigate a motor vehicle or person from one point to another - so streets, street names and parks are the key features present.

Topographical Map

The State Government produce topographical maps for all parts of the state.

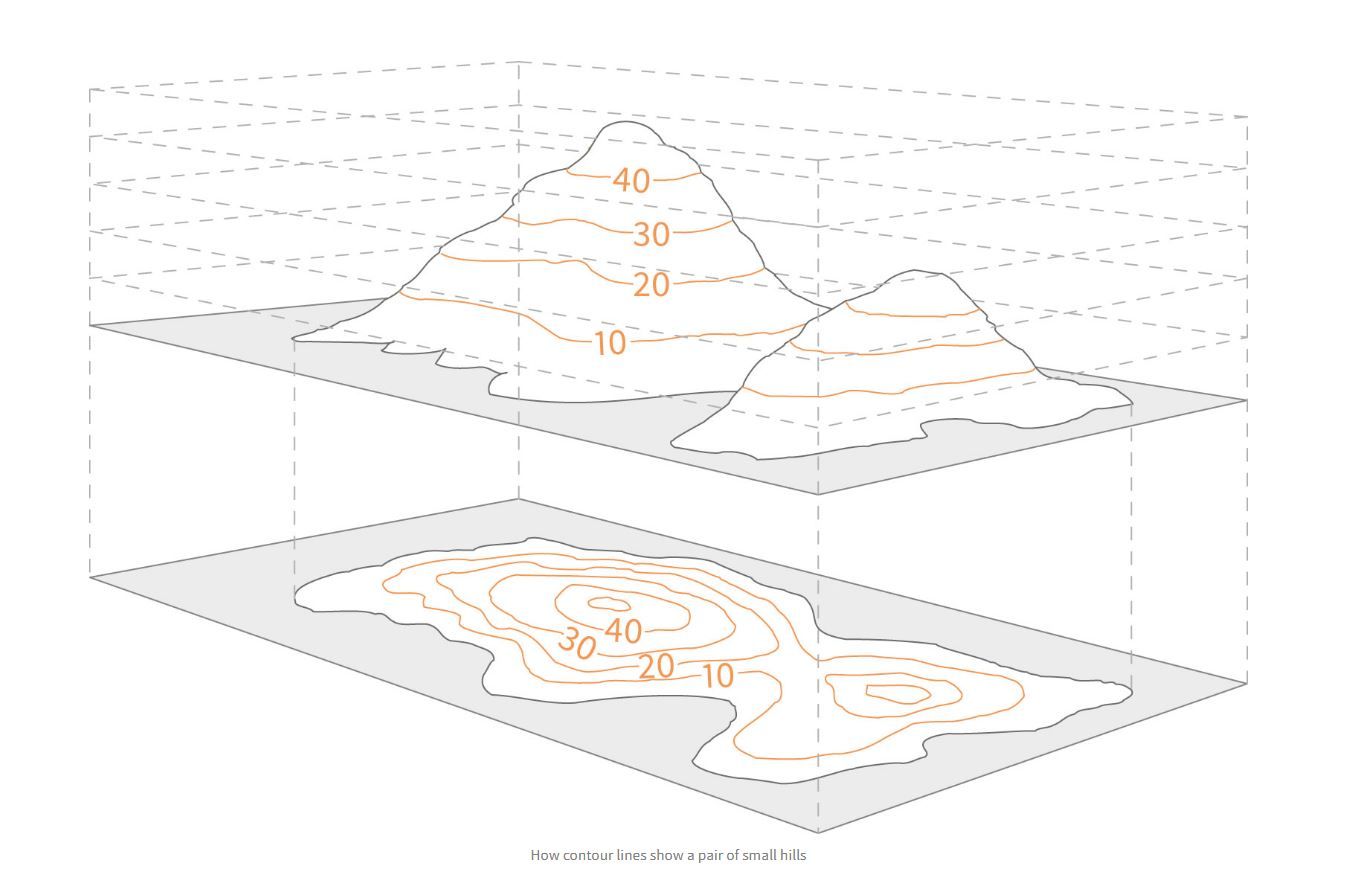
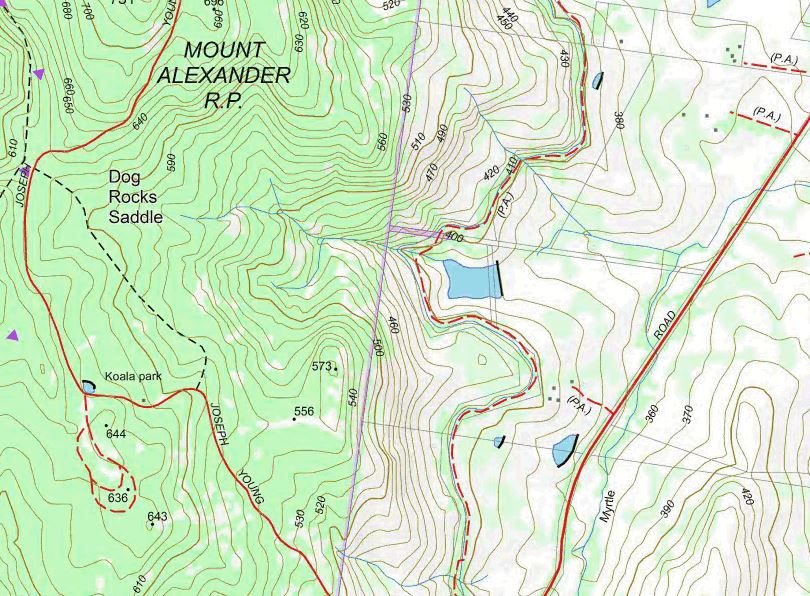
Topographical maps show the shape and key features of terrain. To do this, they provide contours that show the height of the terrain at various points.

While topographic maps are used for recreational purposes, such as travelling, rogaining and orienteering, they are also used by government and industry to assist with urban planning, mining, emergency management and the establishment of legal boundaries and land ownership.

Orienteering Map

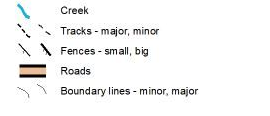
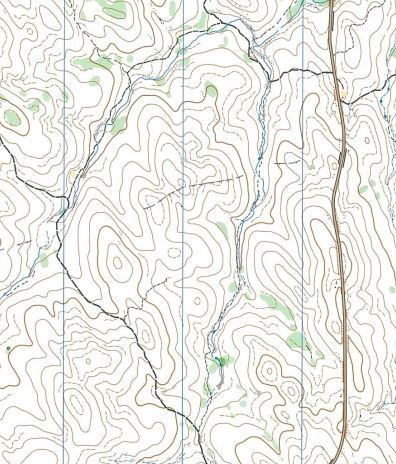
Orienteering maps have contours - but have much more detail than topographic maps. Orienteering maps show all features on the ground that might be visible to a runner moving through the area. 

Features such as rocks, cliffs, fences, pits and vegetation are usually shown on these maps.


Parts of a Map

To be able to read the map and understand what it means, we need to know what the various symbols and markings mean. 
The section below provides an overview of things that will be on most maps

Legend or Key

The legend tells you what the various colours mean and how to interpret the symbols and squiggles that you see on the map. 

Scale Bar

The scale bar tells you how far distances are on the map. Common scales include:

=> 1:250,000 (1cm = 2.5 km) used on topographical maps of our state.

=> 1:25,000 (1cm = 250m) very detailed topographical maps showing properties, houses and roads in a local area.

=> 1:10,000 (1cm = 100m) used on street orienteering and some orienteering maps

=> 1:7,500 (1cm = 75m) the most common scale used in Suburban Adventure Racing

The scale bar is very useful - if you combine distances from the map with a skill such as pace-counting, you are less likely to make mistakes - e.g. by overshooting and missing a track junction.

Compass or North Arrow

It is often helpful to turn the map so it is oriented in the same way as the terrain. Traditionally, maps have a Compass Rose or North arrow on them - and you can use a compass to turn the map the right way around.


Symbols used in Suburban Adventure Racing

Area Symbols

The colours on the map are important - typical colours used on our maps include:

White : Open ground, you can move through
Light Green : Light Vegetation
Dark Green : Dense Vegetation - stay out of this
Green Dots : Scattered trees - runnable
Orange : Clearing/sports ground (no overhead trees)
Yellow : Rough or sandy ground
Blue : Water
Blue Lines : Swamp

Linear Symbols

Long features such as roads and paths are the most common means of navigating from one point to another; these are called linear features.

There are other linear features that can be used, including:

Creeks or watercourses; a watercourse junction is a very good checkpoint location.

Fences - like most linear features, easy to recognise and easy to follow. Typically, checkpoints will be located at a fence corner or fence junction.

There are many other types of linear feature - have a look at some of our sample maps to see how many others you can find.

Point Symbols

Maps contain a number of symbols that identify objects in the landscape. The list above shows some of the more common ones.
Note that point features can be coloured - e.g. a green dot is a tree, a brown dot is an earth mound and a black dot is a large rock.

And finally, there's Contours

Contours are the brown (and often squiggly) lines on a map that show points of equal elevation.
Once you know how to read contours you can read the shape or topography of the landscape. 

Large scale maps - such as the topographical map above - have 25m contours - about the height of a 5 storey building!
Any slope variation less than this disappears between one contour and the next. 

Our maps generally use 5m contours - and sometimes less. As a result, tiny features such as earth mounds, embankments and knolls are all mapped. 
If you compare the map to the terrain, you can actually see the shape of the knolls and other landforms.

The basic concept

The picture above shows two hills, with lines of equal elevation marked on them. The lower level shows what the contours would look like for these hills.

Note the circle at the top of each hill - this is a local highpoint.

On topographical maps, there are numbers on some contours; these tell you the elevation above sea-level at that point. Orienteering maps - ours included - do not print numbers on contours - we leave that to you to work out

Also notable is the shape of the "saddle" between the two hills - a very useful feature when navigating through bush terrain..

Reading slope changes

Crossing contours means you are going uphill or downhill (the height is changing). If the contours are close together, the ground is steep. If the contours are far apart, the ground is flatter.

The red line shows a ridge that runs past a local highpoint. The flat area on the red line, just South of the number 350, is a spur. The ridge ends here and descends steeply into the valley below.

Which way is up?

In more complex areas, people can get confused as to which way is up and which is down. 

The main clue on the map above is the watercourses; these run down gulleys and along the valley (water erosion is, after all, how gulleys and valleys are formed).

Note how many hilltops there are in this area, each separated from the next by gulleys, spurs and saddles - these are the roads and streets of bush navigation.